
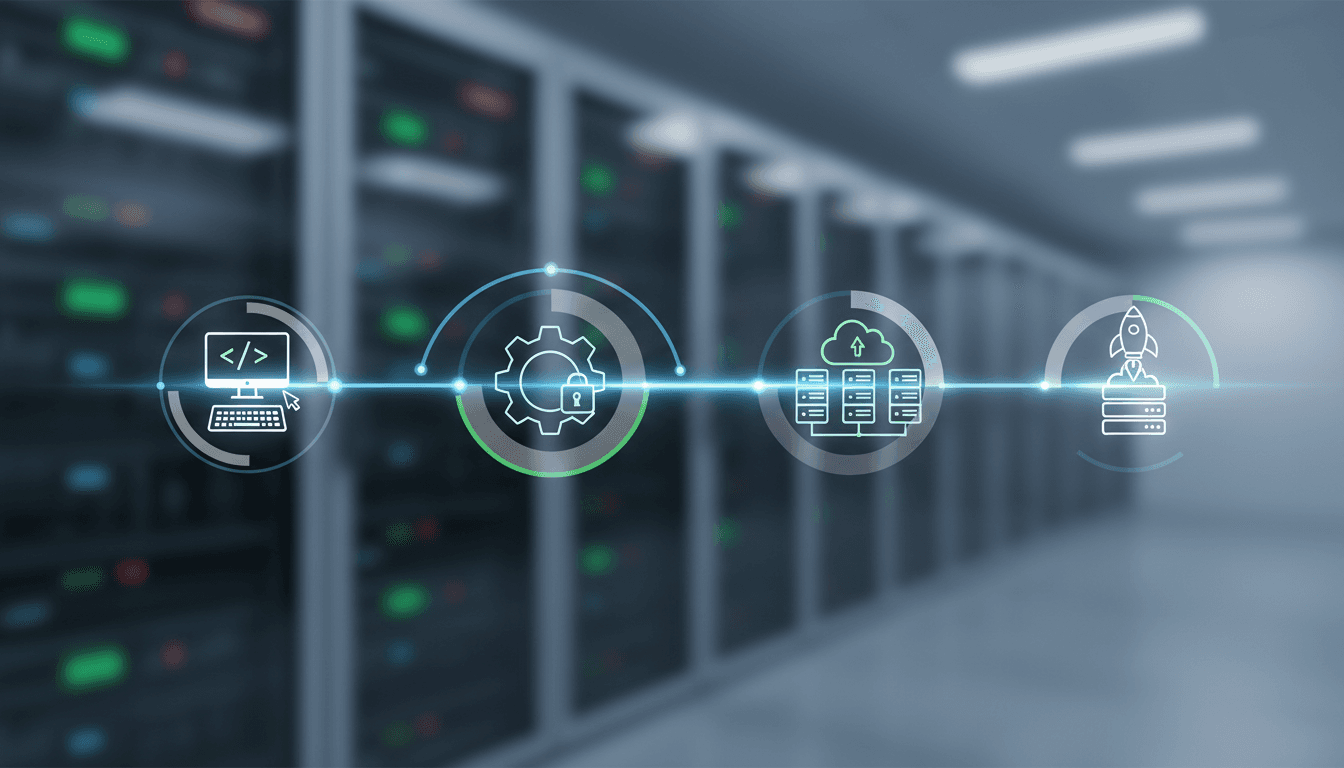
Your Code Isn't Done Until It's Deployed: A Dev's DevOps Guide
The system design interview was going great. We'd whiteboarded a scalable service, picked a database, and even sketched out a caching strategy. Then the interviewer leaned back and asked, "So, how would you deploy this and monitor it in production?" I froze. I talked vaguely about "CI/CD" and "cloud servers," but I had no specifics. That silence cost me the job. It taught me that knowing the core DevOps practices isn't optional anymore; it's a fundamental skill every developer needs to build and ship software effectively.
You don't need to become a full-time platform engineer. But you do need to understand the journey your code takes after you git push. Thinking about operations makes you a better developer, stops you from throwing broken code "over the wall," and, frankly, makes you far more hireable.
It Starts with a Container: Master Your Dockerfile
Forget "it works on my machine." That excuse died a decade ago. Today, the standard answer is containers, and for most of us, that means Docker. A container packages your application with all its dependencies—libraries, system tools, configuration—into a single, portable unit.
This is your new baseline.
If you're a backend or full-stack developer, you should be able to write a solid Dockerfile from scratch. This isn't just about a FROM node:18 line followed by a giant RUN apt-get install ... command. A good Dockerfile shows you understand efficiency. Use multi-stage builds to create lean production images. For a compiled language like Go or Java, you'll have a builder stage with the full SDK to compile your binary, then a final, tiny stage FROM scratch or FROM gcr.io/distroless/static-debian11 that only copies the compiled artifact. This can shrink your image from 1GB to 20MB, which means faster deployments and a smaller attack surface.
Also, learn to structure your COPY commands to take advantage of layer caching. Copy your package.json or pom.xml first, run npm install or mvn dependency:go-offline, and then copy the rest of your source code. This way, Docker won't reinstall all your dependencies every single time you change one line of code. It’s a small trick that saves you minutes on every build.
Automate Everything: Your CI/CD Pipeline Is Your Best Friend
Writing a Dockerfile is step one. Automating the build and deployment process is step two. Continuous Integration (CI) and Continuous Deployment (CD) are the machinery that takes your code, tests it, and gets it to users safely. Your goal as a developer is to trust your pipeline.
You need to know how to configure one.
GitHub Actions has become the default for many projects, and for good reason. It's integrated right into your repository. You should be able to create a .github/workflows/main.yml file that triggers on a push to the main branch. This workflow should, at a minimum:
- Check out the code.
- Set up the correct language environment (e.g., Node.js, Python, Go).
- Install dependencies.
- Run the linter and code formatter to check for style issues.
- Run all unit and integration tests.
- Build your Docker image.
- Push the image to a registry like Docker Hub, GitHub Container Registry (GHCR), or Amazon ECR.
The "CD" part is what happens next. A true Continuous Deployment pipeline automatically deploys the new image to your staging or production environment if all the previous steps pass. This terrifies some teams, so they opt for Continuous Delivery, where the final deployment is a manual button-push. Either way, you should understand how to script these steps. In an interview, if you can say, "I'd set up a GitHub Action to build the Docker image, tag it with the git SHA, push it to ECR, and then trigger a rolling update on our Kubernetes deployment," you sound like you've actually done it before.
Define Your World: Infrastructure as Code (IaC) Basics
The days of a sysadmin manually clicking through the AWS console to provision a server are over. That approach is slow, error-prone, and impossible to replicate. The modern solution is Infrastructure as Code (IaC), where you define your servers, databases, load balancers, and network rules in configuration files.
Terraform is the dominant tool here, and you should know what it is. You write .tf files describing your desired state—"I want one EC2 instance of type t3.micro and one S3 bucket named my-app-data"—and Terraform figures out how to make it happen. You run terraform plan to see what will change, and terraform apply to execute it. This is powerful. It makes your infrastructure version-controlled, reviewable, and repeatable. You can spin up an entire staging environment identical to production with a single command.
Now for the caveat. You don't always need Terraform for every project. If you're building a simple Next.js app, deploying it on Vercel is a fantastic choice. If you have a small side-project, a service like Heroku or Render.com handles all the infrastructure for you. Using IaC for a tiny personal blog is like using a sledgehammer to hang a picture frame—it's overkill and creates unnecessary complexity. Knowing when to use a powerful tool and when to choose a simpler, managed platform is a sign of seniority. The key is understanding the trade-off between control and convenience.
See What's Happening: The Underrated Art of Observability
Your code is deployed. Is it working? How do you know? tail -f production.log isn't an answer. Observability is the practice of instrumenting your application so you can answer questions about its state just by looking at the data it emits.
It's built on three pillars:
- Logs: Don't just
console.log("Error occurred"). Write structured logs, preferably in JSON format. Include a timestamp, a log level (INFO, WARN, ERROR), a descriptive message, and relevant context like auserIdortraceId. This makes logs searchable and analyzable in tools like Datadog, Splunk, or the ELK stack (Elasticsearch, Logstash, Kibana). - Metrics: These are time-series numbers that tell you what your system is doing. How many requests per second? What's the 95th percentile latency? How much memory is the process using? Applications can expose these metrics on an endpoint, and a tool like Prometheus scrapes them periodically. You then use Grafana to build dashboards and set up alerts like, "Ping me on Slack if error rates exceed 5% for more than five minutes."
- Traces: In a microservices world, a single user request might hop between five different services. A trace ties that journey together. By adding a unique
traceIdto every request and propagating it through your services, you can visualize the entire call graph in a tool like Jaeger or OpenTelemetry. You can instantly see that the checkout process is slow because thepayment-serviceis taking 3 seconds to respond.
You don't need to be an expert in all of these, but you need to know what they are and why they matter. Instrumenting your own code to emit useful metrics or structured logs is a huge value-add and shows you think about the entire software lifecycle. It's the difference between a coder and an engineer.
Ready to Ace Your Next Interview?
Practice with AI-powered mock interviews tailored to your target role and company. Start Practicing for Free | Explore Interview Prep